cart on ramp lab
purpose
- Collect distance, velocity, and acceleration
data as a cart rolls up and down a ramp.
- Analyze the position vs. time, velocity vs.
time, and acceleration vs. time
graphs.
- Determine the best fit equations for the
distance vs. time and velocity vs. time graphs.
- Determine
the mean acceleration from the acceleration
vs. time graph.
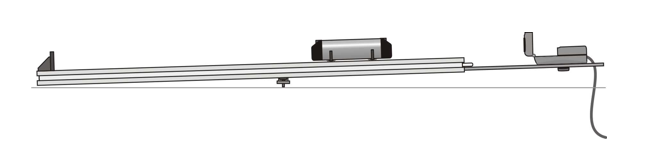
materials
LabQuest
Motion Detector Bracket
LabQuest App
track
Motion Detector
dynamics cart
Motion Detector Bracket
LabQuest App
track
Motion Detector
dynamics cart
procedure
1. Prepare the track and Motion Detector for
data collection.
2. Connect the Motion Detector to DIG 1 of LabQuest and choose New from the File menu.
3. Place the cart on the track near the bottom end stop. If your cart has a plunger, face the plunger away from the Motion Detector. Start data collection. You will notice a clicking sound from the Motion Detector. Wait about a second, then briefly push the cart up the ramp, letting it roll freely up nearly to the top, and then back down. Catch the cart as it nears the end stop.
- Attach the Motion Detector Bracket to the track
- Attach the Motion Detector to the Motion Detector
Bracket.
- Adjust the position of the Motion Detector Bracket so
the Motion Detector is 0.15 m from the end of the track.
- Set the switch on the Motion Detector to the Track
position.
2. Connect the Motion Detector to DIG 1 of LabQuest and choose New from the File menu.
3. Place the cart on the track near the bottom end stop. If your cart has a plunger, face the plunger away from the Motion Detector. Start data collection. You will notice a clicking sound from the Motion Detector. Wait about a second, then briefly push the cart up the ramp, letting it roll freely up nearly to the top, and then back down. Catch the cart as it nears the end stop.
data/analysis
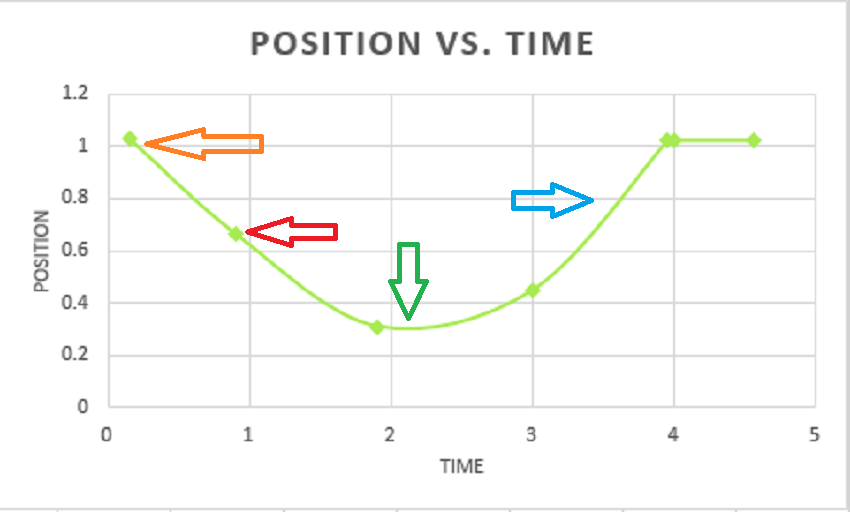
o-cart being pushed
r-rolling up
g-highest point
b-rolling down
r-rolling up
g-highest point
b-rolling down
o-cart being pushed
r-rolling up
g-highest point
b-rolling down
r-rolling up
g-highest point
b-rolling down
r-rolling up
g-rolling down
conclusion
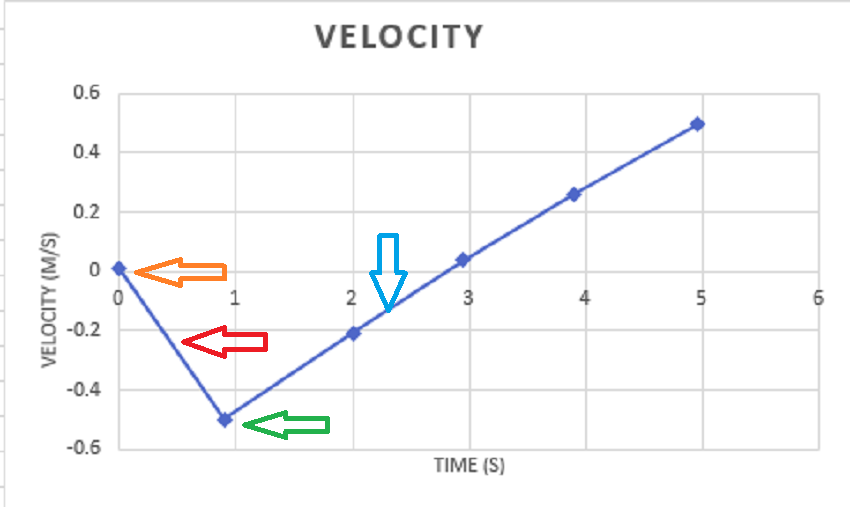
1. How closely does the slope correspond to the acceleration you found in the previous step? (Compare the slope from the velocity graph and the value from the acceleration graph.)
slope= 0.237981
The slope and acceleration should be the same but our graphs are in the wrong place because the points were changed so much that the acceleration and slope were not the same.
2. What was the velocity of the cart at the top of
its motion?
At the top of the cart its motion, it had no velocity because its not moving.
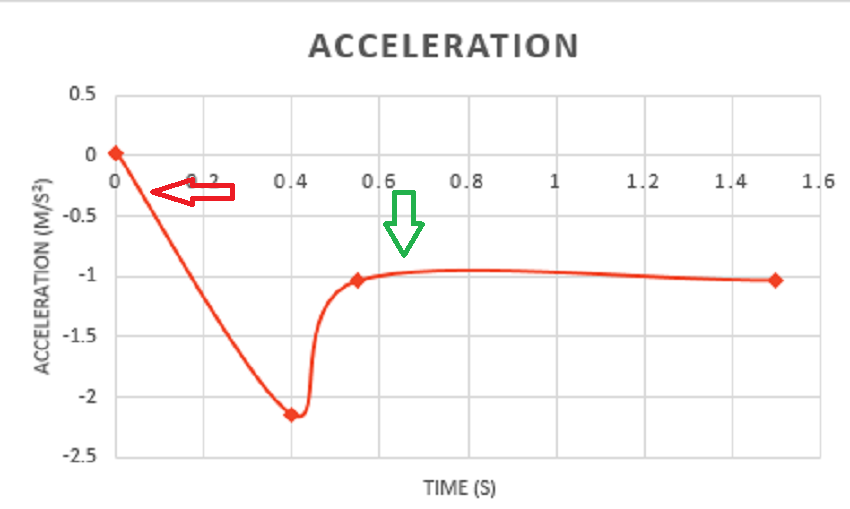
3.What was the acceleration of the cart at the top of its motion?
it has no acceleration because its not moving.
4.Is the cart’s acceleration constant during the
free-rolling segment?
When the cart was going up there was not a constant acceleration because it was pushed but on the way down it was a constant acceleration.
5. Review your preliminary questions, based on
your new knowledge do you still agree with your prediction? Why or why
not?
No. our sketches of the graph were all wrong because we based them of the position of the cart.
6. Explain what the meaning of the equation that
you found for the velocity time graph.
Label each variable and explain what the meaning of the slope
is.
y=0.237981x+0
the slope (0.237981) is what the line goes up by, the x is the time , and the 0 means that the line is linear.
7. Predict what the position vs time, velocity vs time, and the acceleration vs time would be for an object that was falling straight down, rather than being on an
incline.
If the line was straight down then it would be thrown
slope= 0.237981
The slope and acceleration should be the same but our graphs are in the wrong place because the points were changed so much that the acceleration and slope were not the same.
2. What was the velocity of the cart at the top of
its motion?
At the top of the cart its motion, it had no velocity because its not moving.
3.What was the acceleration of the cart at the top of its motion?
it has no acceleration because its not moving.
4.Is the cart’s acceleration constant during the
free-rolling segment?
When the cart was going up there was not a constant acceleration because it was pushed but on the way down it was a constant acceleration.
5. Review your preliminary questions, based on
your new knowledge do you still agree with your prediction? Why or why
not?
No. our sketches of the graph were all wrong because we based them of the position of the cart.
6. Explain what the meaning of the equation that
you found for the velocity time graph.
Label each variable and explain what the meaning of the slope
is.
y=0.237981x+0
the slope (0.237981) is what the line goes up by, the x is the time , and the 0 means that the line is linear.
7. Predict what the position vs time, velocity vs time, and the acceleration vs time would be for an object that was falling straight down, rather than being on an
incline.
If the line was straight down then it would be thrown
