Wingspan labErica
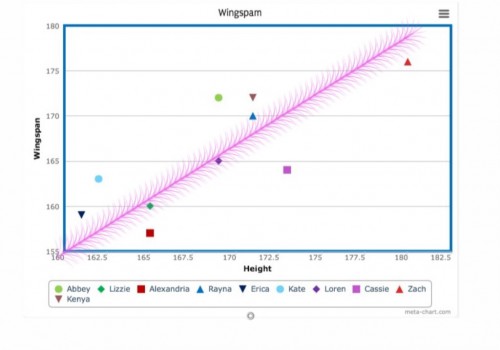
On Wednesday, we measured everyone’s height and wingspan
and put them in a table. We then incorporated everyone’s data onto a scatter plot, and even put a line of best
fit on the graph to help.
and put them in a table. We then incorporated everyone’s data onto a scatter plot, and even put a line of best
fit on the graph to help.
- One pattern that you might see is that most people's wingspan is smaller
than their height. Another pattern you might recognize is that all of numbers
are between 150 and 180, meaning that they are all relatively close. - Our line of best fit crosses at the coordinates 155 and 160. The height of
the students was no less than 155cm. And the wingspan of the students was
no less than 160. - We would expect the line to cross (0,0) because if our line of best fit went
farther down it would eventually cross the origin. - You could use a graph to predict a person’s wingspan by looking at their
height on a graph and estimating the wingspan to be around the same as the
height. - If a boy was 91cm tall, you could estimate his wingspan to be in the
range of 85 to 95 because in our data all of the people’s height was close
to their wingspan.
